数据可视化相关图书会按更新时间、出版时间和评分持续整理,适合从主题维度系统浏览。
Excel数据可视化——从图表到数据大屏
郭宏远
评分 暂无
洞悉数据
Hunter Whitney
评分 6.5分
“经过多年的历练,Whitney在用户界面设计方面积累了深厚的专业技能,尤其是在数据可视化方面……Whitney不仅写作功底好,而且设计了一本书来支撑他主张的设计原则。这本书很美,为数据可视化领域增添了实际价值。对于任何想在该领域拥有精湛技术、超群效率的从业者,我都强烈推荐这本书。”——Visual Business Intelligence博客,2014年2月11日 “Hunter Whitne
Python数据可视化
(印度)科斯·拉曼
评分 5.8分
ggplot2
Hadley Wickham
评分 8.8分
This book describes ggplot2, a new data visualization package for R that uses the insights from Leland Wilkison''s Grammar of Graphics to create a powerful and flexible system for creating data graphi
Python数据可视化之美:专业图表绘制指南(全彩)
张杰
评分 6.7分
Python数据可视化之matplotlib精进
刘大成
《Python数据可视化之matplotlib实践》使用大量的matplotlib 实用案例讲解Python 数据可视化在各个应用方向上的实现方法。通过学习这些实用案例,读者可以更好地掌握Python 数据可视化的高级技能。本书主要由图形、元素、交互、探索和拓展5 部分组成,每部分的实用案例都有利于拓展matplotlib 的应用视野,而且案例中的示例代码只涉及Python 的基础知识。这样,在P
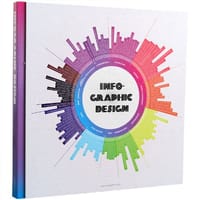
Infographic Design–信息图形设计
吴宗敏、吴祖斌
评分 7.7分
Infographic Design mainly focuses on the discovery and research ofthe infographic design cases around the world including the way finding,information, administrative documents, financial information,
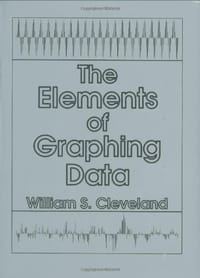
The Elements of Graphing Data
W.S. Cleveland
图解交互设计:UI设计师的必修课
评分 6分
本书紧扣用户界面设计趋势,主要包括交互设计理论、交互设计的理念与方法、用户体验设计、交互设计心理学、用户需求研究、交互设计的视觉界面设计、网站UI交互设计、移动端交互设计、交互设计团队等方面的内容。本书旨在普及用户界面设计的相关理念,全面阐述用户界面设计在网页及移动端两大主流设计领域的具体表现和所需掌握的专业技能。 本书可供UI设计师、交互设计师、用户体验专家、网页设计师等专业人士提高设计技能、
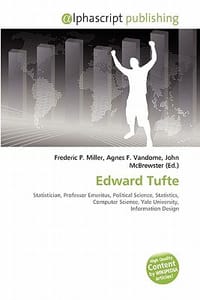
Edward Tufte
Miller, Frederic P.; Vandome, Agnes F.; McBrewster, John
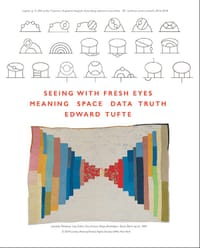
Seeing with Fresh Eyes
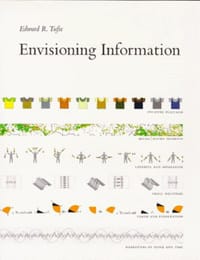
Envisioning Information
Edward R. Tufte
评分 9.1分
This book celebrates escapes from the flatlands of both paper and computer screen, showing superb displays of high-dimensional complex data. The most design-oriented of Edward Tufte's books, Envisioni
Beautiful Evidence
评分 8.6分
Science and art have in common intense seeing, the wide-eyed observing that generates visual information. Beautiful Evidence is about how seeing turns into showing, how data and evidence turn into exp
数据之美
[美] 邱南森 (Nathan Yau)
评分 7.5分
这是一本教我们如何制作完美可视化图表,挖掘大数据背后意义的书。作者认为,可视化是一种媒介,向我们揭示了数据背后的故事。他循序渐进、深入浅出地道出了数据可视化的步骤和思想。本书让我们知道了如何理解数据可视化,如何探索数据的模式和寻找数据间的关联,如何选择适合自己的数据和目的的可视化方式,有哪些我们可以利用的可视化工具以及这些工具各有怎样的利弊。 作者给我们提供了丰富的可视化
Dear Data
Giorgia Lupi, Stefanie Posavec
评分 8.5分
Equal parts mail art, data visualization, and affectionate correspondence, Dear Data celebrates "the infinitesimal, incomplete, imperfect, yet exquisitely human details of life," in the words of Maria
现代统计图形
赵鹏, 谢益辉, 黄湘云
评分 8分
● 久享盛誉的数据分析与统计图形专著 ● 倾囊相授化数据为图形的“术”与“道” ● 28位行业大咖联合推荐 常言道,一图胜千言。本书根据统计图形制作的需要,系统性地介绍了从古至今的众多统计图形案例,旨在展现统计图形在数据分析领域有待充分挖掘的潜力和价值。书中集中讲解了现有统计图形的种类、特点、图形元素、适用场合等,并且配以相应的统计数据分析实例,深入说明各种统计图形的用法、含义和作图技巧。同时,本
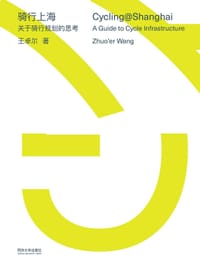
骑行上海:关于骑行规划的思考
王卓尔
本书对自行车发展历史及国内外现况进行了比对,随后由上海中心城区切入进行骑行系统进行调查及研究,在参考了国际自行车友好城市案例及规划后,对上海未来慢行系统进行规划及构想,并在此基础上挑取了部分节点及路段予以设计。
CiteSpace
李杰, 陈超美
评分 7.8分
陈超美, 李杰
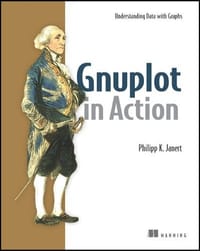
Gnuplot in Action
Philipp Janert
HIGHLIGHT Gnuplot in Action is the first comprehensive introduction to gnuplot - from the basics to the power features and beyond. Besides providing a tutorial on gnuplot itself, it demonstrates h
Creating Data Stories with Tableau Public
Ashley Ohmann, Matt Floyd
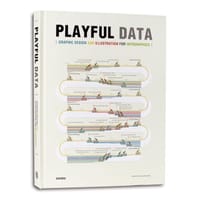
Playful Data
Wang Shaoqiang
《好玩的数据:信息图与数据可视化设计》将告诉你平面设计师、插画师、艺术家乃至科学家是如何运用可视化设计来表现信息和数据的。平凡的数据在他们的笔下变得活灵活现;好玩的插画清晰地传达信息,同时注重设计的法则:色彩的协调性、图象的关联性、文本的可读性以及主次信息的等级性等。本书分为四大章节:数据统计图、流程图、地图以及指示说明图。书中收录的100多个项目中,有些数据的获得是基于严谨和精确的科学实验,真实
D3.js数据可视化实战手册
[加]Nick Qi Zhu
评分 7.4分
如今这个互联网时代,人们每天都产生海量的数据,如果直接面对这些数据,可能让人无从下手。将数据可视化,用形象立体的形式将其展现,有利于分析其中的关联,攫取可能存在的商业机会。本书意图通过大量的示例和代码,向读者讲述如何利用D3.js来实现数据可视化。只要读者了解JavaScript,就能完全掌握本书的内容。
Data Feminism
Catherine D'Ignazio, Lauren F. Klein
评分 8.3分
A new way of thinking about data science and data ethics that is informed by the ideas of intersectional feminism. Today, data science is a form of power. It has been used to expose injustice, improve
The Grammar of Graphics
Leland Wilkinson
评分 9.4分
Presents a unique foundation for producing almost every quantitative graphic found in scientific journals, newspapers, statistical packages, and data visualization systems The new edition features six
乐见数据
马世权
评分 7.9分
本书从现象问题“大多数人不是不知道怎样去做可视化图表,而是不知道什么是好的可视化图表”入手,以GLAD原则为主线,对症下药,各个突破。本书共分为5章,第1章整体介绍拯救图表的“配方”——GLAD原则;第2章带你体验探索性数据分析可视化的全过程,直达数据洞察的高度;第3章介绍“少即是多”的设计理念;第4章传授如何把控图表设计尺度的理念;第5章讲解“精准表达”的黄金15秒。本书设置了大量的真实数据案例
D3.js in Action
Elijah Meeks
Table of Contents Part 1: An Introduction to D3 1 An introduction to D3.js 2 Information Visualization Data Flow 3 D ata-Driven Design and Interaction Part 2: The Pillars of Information Visualization
Information Design Source Book (German and English Edition)
Institute for Information Design Japan
在线阅读本书 Informationsdesign ist ein zentrales Instrument zur Lösung von Kommunikationsaufgaben und Anwendungsbereich zahlreicher verfügbarer Medien: Druck- und elektronische Medien, architektonische El
Readings in Information Visualization
Stuart K. Card, Jock Mackinlay, Ben Shneiderman
This groundbreaking book defines the emerging field of information visualization and offers the first-ever collection of the classic papers of the discipline, with introductions and analytical discu
The Visual Miscellaneum
David McCandless
评分 8.7分
The Visual Miscellaneum is a unique, groundbreaking look at the modern information age, helping readers make sense of the countless statistics and random facts that constantly bombard us. Using cutti