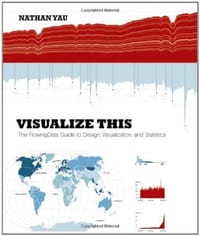
Visualize This
出版时间
2011-07-20
ISBN
9780470944882
评分
★★★★★
书籍介绍
Practical data design tips from a data visualization expert of the modern age Data doesn?t decrease; it is ever-increasing and can be overwhelming to organize in a way that makes sense to its intended audience. Wouldn?t it be wonderful if we could actually visualize data in such a way that we could maximize its potential and tell a story in a clear, concise manner? Thanks to the creative genius of Nathan Yau, we can. With this full-color book, data visualization guru and author Nathan Yau uses step-by-step tutorials to show you how to visualize and tell stories with data. He explains how to gather, parse, and format data and then design high quality graphics that help you explore and present patterns, outliers, and relationships. Presents a unique approach to visualizing and telling stories with data, from a data visualization expert and the creator of flowingdata.com, Nathan Yau Offers step-by-step tutorials and practical design tips for creating statistical graphics, geographical maps, and information design to find meaning in the numbers Details tools that can be used to visualize data-native graphics for the Web, such as ActionScript, Flash libraries, PHP, and JavaScript and tools to design graphics for print, such as R and Illustrator Contains numerous examples and descriptions of patterns and outliers and explains how to show them Visualize This demonstrates how to explain data visually so that you can present your information in a way that is easy to understand and appealing.
From the Author: Telling Stories with Data
Author Nathan Yau A common mistake in data design is to approach a project with a visual layout before looking at your data. This leads to graphics that lack context and provide little value. Visualize This teaches you a data-first approach. Explore what your data has to say first, and you can design graphics that mean something.
Visualization and data design all come easier with practice, and you can advance your skills with every new dataset and project. To begin though, you need a proper foundation and know what tools are available to you (but not let them bog you down). I wrote Visualize This with that in mind.
You'll be exposed to a variety of software and code and jump right into real-world datasets so that you can learn visualization by doing, and most importantly be able to apply what you learn to your own data.
Three Data Visualization Steps:
1) Ask a Question
(Click Graphic to See Larger Version)
When you get a dataset, it sometimes is a challenge figuring out where to start, especially when it's a large dataset. Approach your data with a simple curiosity or a question that you want answered, and go from there.
2) Explore Your Data
(Click Graphic to See Larger Version)
A simple curiosity often leads to more questions, which are a good guide for what stories to dig into. What variables are related to each other? Can you see changes over time? Are there any features in the data that stand out? Find out all you can about your data, because the more you know what's behind the numbers, the better story you can tell.
3) Visualize Your Data
(Click Graphic to See Larger Version)
Once you know the important parts of your data, you can design graphics the best way you see fit. Use shapes, colors, and sizes that make sense and help tell your story clearly to readers. While the base of your charts and graphs will share many of the same properties – bars, slices, dots, and lines – the final design elements will and should vary by your unique dataset.
AI导读
核心看点
- 作者Nathan Yau结合统计学背景,讲解数据可视化全流程。
- 通过Python采集、R绘图、Illustrator精修,实现数据故事化。
- 提供从数据清洗到图形设计的步骤教程,强调数据背后的真相。
适合谁读
- 对数据可视化感兴趣,希望动手实践入门的初学者。
- 从事市场调研、统计分析或需要以数据说话的从业者。
- 熟悉R语言或Python,希望提升图表设计美感的理科生。
读前提醒
- 书中部分代码存在错误,且资源链接可能已失效,需自行搜索。
- 建议结合作者博客FlowingData阅读,以获取更及时的更新。
- 本书侧重设计流程与工具应用,非深入算法或底层编程指南。
读者共识
- 内容完整且难度适中,是数据可视化领域优秀的入门级读物。
- 作者统计学背景深厚,但部分技术细节随时间推移显得过时。
- 虽有时效性局限,但其“数据讲故事”的理念仍具重要参考价值。
本导读基于书籍简介、目录、原文摘录、短评和书评生成,不等同于全文精读。
精彩摘录
- "datafl.ws/12i."
- "datafl.ws/12i"
- "Modest Maps is a BSD-licensed display and interaction library for tile-based maps in Flash (ActionScript 2.0 and ActionScript 3.0) and Python."
- "That was more than twice the amount anyone in the world had eaten before him."
- "hard-coded array"
- "数据就静静地待在我们生活的每一个角落。园子里已经果实累累,正等待我们去采摘。对大多数人来说,真正有意思的并不是数据本身,而是数据背后蕴涵的信息。"
- "请记住,数据是现实生活的一种映射,其中隐藏着许多故事,在那一堆堆的数字之间存在着实际的意义、真相和美学。而且和现实生活一样,有些故事非常简单直接,有些则颇为迂回费解。有些故事只会出现在教科书里,而其他一些则体裁新奇。讲故事的方式完全取决于你自己,不管你的身份是统计学家、程序员、设计师还是数据研究者。"
John Wiley & Sons的其他书籍查看全部
 Bank 4.0
 Word 2019 For Dummies
 Strategy Beyond the Hockey Stick
 Project Management
 Unmasking the Social Engineer
 The Essays of Warren Buffett (4/e)
下载
收藏