
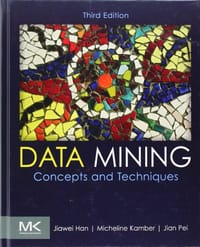
书籍介绍
这不是一本让你速成「数据科学家」的书,而是一套帮你建立数据挖掘整体观的经典教材。读者反复提到它「致力于挖掘体系的构建,而非某个算法」——从数据预处理、特征选择到模式发现、聚类分类,它更关心的是让你理解整个流程的来龙去脉,而非追逐某个时髦模型。正因如此,它被许多人当作「当字典查」的参考书和当年机器学习课的指定教材。但它的争议也源于此:覆盖面极广,某些章节却一笔带过,讲得简略,想逐章啃透会感到「不知所云」,甚至被读书会戏称「考古」。所以它真正适合的是想系统搭框架的入门者,以及把它当作工具书按需查阅的人;若追求深度与算法细节,或许需要配合Coursera课程或换书补充。
AI导读
核心看点
- 权威教材,系统讲解数据挖掘概念与技术
- 涵盖数据仓库、OLAP及FP-Growth等核心算法
- 多学科集成,融合统计、机器学习与数据库技术
读者共识
- 内容全面清晰,适合入门,但深度略显不足
- 经典教材地位稳固,但部分技术已显过时
- 理论性强,缺乏具体代码实现,需结合实践
精彩摘录
- "并非所有的系统都进行真正的数据挖掘。不能处理大量数据的数据分析系统,最多只能称作机器学习系统、统计数据分析工具或实验系统原型。一个系统只能进行数据或者信息检索,包括在大型数据库中找出聚集值或回答演绎查询,更应归类为数据库系统,或信息检索系统,或演绎数据库系统。 数据挖掘涉及多学科技术的集成,包括数据库和数据仓库技术、统计学、机器学习、高性能计算、模式识别、神经网络、数据可视化、信息检索、图像与信号处理以及空间或时间数据分析。"
- "对用户进行分类、对用户行为进行发掘 数据挖掘可以提供比Web搜索服务更多的帮助。 根据Web页面之间的链接关系,进行权威Web页面分析(authoritative Web page analysis)可以根据Web页面的重要性、影响性和主题,对网页进行排序。 自动Web页面聚类和分类有助于基于页面的内容,以多维的方式对Web页面进行分组和安排。 Web社区分析有助于识别隐藏的Web社会网络和社团,并观察它们的演变。"
- "频繁模式(frequent pattern)是在数据中频繁出现的模式。存在多种类型的频繁模式,包括项集、子序列和子结构。"
- "2.2.1. Measuring the Central Tendency: Mean, Median, and Mode"
- "moda <- function(arr){ sort.arr <- sort(arr) max_count <- 0 count <- 0 last <- 0 for(x in sort.arr){ if(x == last){ count <- count + 1 }else{ last <- x if(count > max_count){ max_count <- count } } } return (last) }"
- "2.2.3. Graphic Displays of Basic Statistical Descriptions of Data"
- "A scatter plot is one of the most effective graphical methods for determining if there appears to be a relationship, pattern, or trend between two numeric attributes. library(car) scatterplot(mpg ~ wt | cyl, data=mtcars, xlab="Weight of Car", ylab="Miles Per Gallon", main="Enhanced Scatter Plot", la"
- "χ2 Correlation Test for Nominal Data"
用户评论
在读书会合作者的敦促下,每周读几节,读了好多个月,终于考古完了。有几章节写的太简略了,我们换书继续接上。
每次读书会会总结一下哪些地方还有用,哪些已经真的过时了,感觉考古还挺好玩的。
韩老师的书确实不敢恭维,可能不是自己亲自写的吧。看的是英文版的,看来一般就看不下去了,讲了很多东西,到那时都是一笔带过,读完之后不知所云。
推荐和Coursera的专项课程一起听。Coursera的Slides给出了书中很多较为简略环节的参考文献,书和课程组合,兼顾基础与引申。在线课程精心准备,游戏化做得非常棒,习题集还搞了个名人堂机制,动力满满啊!论坛也很活跃,负责算法R实现那个TA尤其赞,学到了很多!
狂赶死线总算学完了:) @2020-06-12 08:25:28
good textbook, even though i decided not to follow the path towards a trendy so-called data scientist.
这么厚的书当字典好了。
看韩J的书<1.25倍听韩的课<读韩的PPT。
好久没有仔细看完一本教材了。
算是一本讲解基础知识的书。但是缺少很多细节method还有应用方式。倒是可以作为入门书籍。
The most verbose textbook I've read in a while.
你可能会关注的书籍
 Advanced Data Mining and Applications
 Introduction to Data Mining, Second Edition
 Introduction to Data Mining
 Learning Data Mining with Python - Second Edition
 Web Data Mining
Morgan Kaufmann的其他书籍查看全部
 Freemium Economics
 Computer Organization and Design, Fifth Edition
 Design Research Through Practice
 Computer Networks, Fifth Edition
 TCP/IP Sockets in Java, Second Edition
 Sketching User Experiences
下载
收藏